


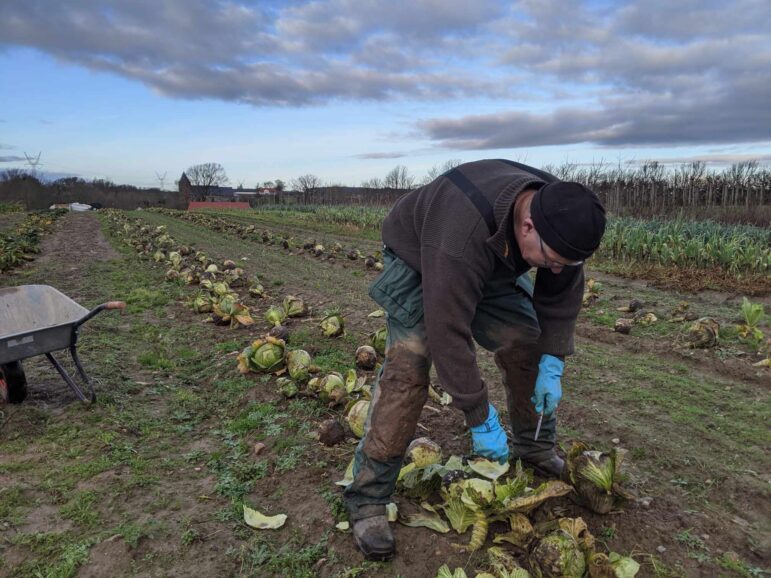
Our analysis underscores the urgent need for updated and reliable agricultural data in Europe to support effective policy making. Photo: Nicoline Noe.
As part of this analysis, Kaas & Mulvad have processed thousands of data points. The work has been carried out for Greenpeace Europe. Although the analysis is conducted with a view to political considerations by Greenpeace, we adhere to the strictest criteria for objectivity in our work.
Initially, we must begin by stating that we find the current state of agricultural data transparency in Europe concerning, particularly as outdated data hampers informed policy decisions.Significant green initiatives, such as the requirement to leave 4% of agricultural land fallow, are being abandoned without thorough assessments of farmers’ conditions. Accurate and up-to-date data is crucial for understanding these conditions, yet the most recent Farm Structure Survey (FSS) dates back to 2020.
Preliminary data from the Farm Accountancy Data Network (FADN) for 2022 has been used as a base for this analysis, but data from six European countries are missing for the year as it has not yet been validated. Gaps in methodological transparency, inactive links, and a lack of responses from FADN to inquiries suggest a worrying decline in data support. This is likely due to a shift in focus toward developing the Farm Sustainability Data Network (FSDN), which will replace FADN in two years. The Commission’s emphasis on future sustainability metrics raises questions about its current commitment to addressing ongoing agricultural challenges.
Despite these limitations, we have adapted FADN data to offer a more current perspective, though it is not designed for general trend analysis. Additionally, the absence of data from six countries, representing nearly one million commercial farms, means we must rely on 2021 figures for these countries to estimate trends.
Overall, this underscores the urgent need for updated and reliable agricultural data in Europe to support effective policy making.
Challenges: The structural landscape
FADN was not designed to highlight the structural development of agriculture, but through our data analysis, we have managed to create an overview, though the results should be seen as indicative trends rather than precise depictions of developments. Despite data flaws, the conclusion is clear: EU agriculture is increasingly consolidating into fewer, larger operations.
The most dramatic losses have occurred among smaller farms, suggesting a consolidation trend where fewer, larger farms dominate. The rapid disappearance of small farms underscores the ongoing structural transformation in European agriculture, driven by economic pressures, modernization, and subsidy policies favouring farms with large landholdings.
The 2022 data on EU farm sizes highlights this growing concentration of large farms. Approximately 295,000 farms—8% of all commercial farms—have an economic output of €250,000 or more. Medium and semi-large farms, producing between €50,000 and €250,000, grew by 4%, adding 30,000 farms, and now account for a quarter of all EU farms.
Meanwhile, 67% of commercial farms—around 2.4 million—generate less than €50,000 in output, and this group has shrunk by 44% since 2007, indicating a sharp decline in small farms.
Comparing data from FSS and Eurostat reveals a stark picture of the decline in small farms. In 2020, out of the EU’s 9.1 million farms, 3.3 million had a standard output below €2,000 per year and contributed only 1% of the EU’s total agricultural output. Between 2005 and 2020, the number of farms smaller than 5 hectares—largely those FADN classifies as non-commercial—decreased by 4.6 million, with the total number of farms in the EU shrinking by 37%. This aligns with FADN data, which shows a 33% reduction in commercial farms from 2007 to 2022.
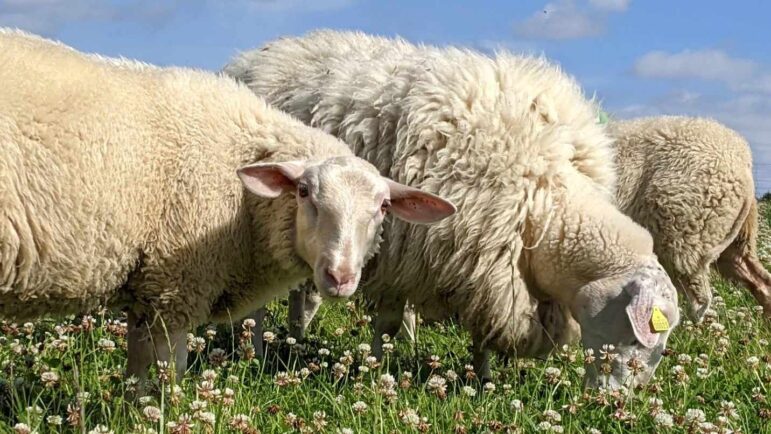
Of the 9.1 mio farms in the EU in 2020, only 7% were non-family farms, yet they controlled almost 40% of the UAA (Utilised Agricultural Area).
Of the 9.1 mio farms in the EU in 2020 only 7 pct. were non-family farms, yet they controlled almost 40% of the Utilised Agricultural Area. Photo: Nicoline Noe.
At the national level
Farm size distribution varies significantly across the EU. In seven countries (Belgium, Denmark, Germany, France, Luxembourg, the Netherlands, and Slovakia), more than 25% of farms are classified as large. In contrast, 12 countries, including Bulgaria, Greece, and Poland, have over 75% of farms classified as small. Eight countries, such as Spain and Italy, exhibit a more balanced distribution of farm sizes.
Nine EU countries were analysed alongside data for overall EU agriculture. Farm consolidation is evident in all nine, though the pace varies. France and Austria have been more successful in preserving small farms compared to other developed agricultural nations, but both still face ongoing consolidation. Even Greece, historically reliant on small farms, has seen a decline in small holdings and a rise in larger farms. Denmark represents the most extreme example of concentration, driven in part by favourable VAT policies for large farms.
From 2007 to 2022, agricultural production has increasingly concentrated in larger farms, reshaping the EU’s agricultural structure. This trend is expected to continue, especially in countries with many small farms, making their survival increasingly challenging.
Challenges in data and misleading results
FADN is a survey based on responses from 80,000 farms across the EU. These farms are given a weighted average to represent others of similar size and specialisation. However, a significant limitation in the data arises when fewer than fifteen farms in a size category are surveyed, leading to the absence of data for that group. This FADN policy ensures farm anonymity but, in practice, results in certain groups being excluded from the final statistics. For instance, in Greece, no data exists for farms larger than €250,000 between 2007 and 2020 due to the small sample size, with data for larger farms only available from 2021. As a result, the statistics can be misleading, as they fail to capture the presence of these farms in earlier years.
Another issue that may distort the trend in structural development is how the economic size categories of farms are determined. The statistical measure, standard output (SO), used to define the current economic size of farms, is calculated based on farm-gate prices from the past five years, making it somewhat comparable to real prices. However, the SO thresholds for the different farm size categories have remained fixed in nominal terms from 2007 to 2022. This means that many farms appear to transition into larger size groups primarily due to inflation and rising price indices, rather than actual growth in farm size or productivity.
To this, we can add that the lower threshold for what can be considered a commercial farm is set by the various member states. There is a significant difference in what is regarded as commercial across the EU. Some countries, like Greece, have a lower threshold of €4,000, while others, such as Denmark, set the threshold at €25,000. The countries collect data differently, and this data is subsequently processed in a “pressure cooker” by FADN.
Yet, this inflation-driven shift does not explain the broader trend of declining agricultural holdings. Between 2005 and 2020, the number of farms in the EU decreased by around 37%, resulting in a loss of 5.3 million farms, as highlighted by Eurostat. Notably, approximately 87% of these (4.6 million) were small farms, those under 5 hectares, illustrating the disproportionate impact of this trend on small-scale agriculture.
UK data and its absence
The exclusion of UK farms from the FADN data utilised for this analysis has had a notable impact. From 2020 to 2021, approximately 100,000 UK farms, along with 200,000 annual work units and 15 million hectares, were taken out of the dataset, resulting in a significant drop in overall farm numbers. When cleaned from UK farms, the EU’s total farm count still decreased by 3,800 from 2020 to 2021, driven by the disappearance of 7,660 farms in the small farm category. Meanwhile, the middle group increased by 1,670 farms, and the large group grew by 2,190 farms. If the UK farms were deducted, the trend toward concentration in larger farms would become even more pronounced than in the data analysed.
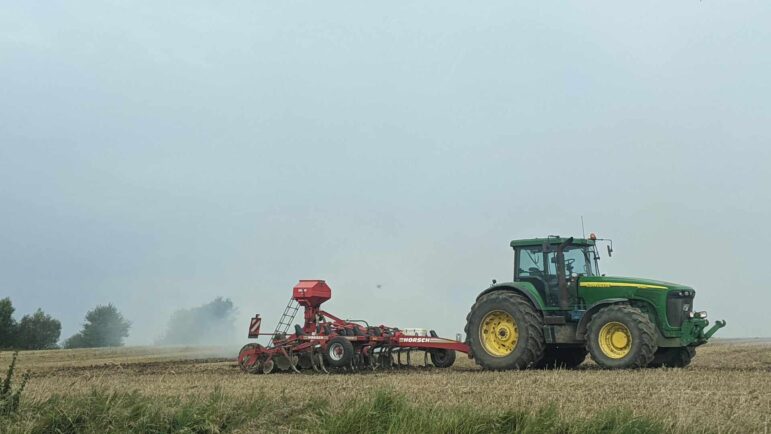
In 2022, the total number of annual work units (AWU) in EU agriculture reached 5.8 million full-time positions, reflecting a nearly 40% decrease in employment since 2007 – a loss of approximately 3.6 million jobs during this period. Photo: Nicoline Noe.
Findings: Subsidies and agricultural area
According to data from the European Commission, approximately 6 million farms received direct payments in 2021, with half of these being under 5 hectares and likely classified as subsistence farms. These 3 million small farms received only 5.8% of direct payments, suggesting that about 5-6 % of total direct payments may not be captured in the FADN data due to the exclusion of non-commercial farms.
Moreover, our calculations indicate that the overall figure for direct payments may be slightly inflated, likely due to inaccuracies in the weighting of farms. Nonetheless, we can reasonably conclude that the relative scale of subsidy allocation among farm size groups remains consistent, reflecting the underlying trends in the distribution of agricultural subsidies in the EU.
The distribution of direct payments among commercial farms in the EU exhibits significant variation by country. Generally, these payments align with the amount of utilised agricultural area (UAA) owned by a farm.
Across the EU, small farms make up 67 % of the commercial farms. They control 25% of the UAA and receive 25% of direct payments, while medium-sized farms constitute 24 % of the farms, manage two fifths of the UAA and receive 38 % of the payments. Large farms hold 37% of direct payments and fairly the same percentage of UAA, and account for 8% of the farms.
This indicates that subsidies, overall, still do not sufficiently address the issue of the green transition. Instead of rewarding size it should be distributed with a higher focus on the reduction of Co2 and nitrogen and supporting biodiversity, among other things.
Labour
In 2022, the total number of annual work units (AWU) in EU agriculture reached 5.8 million full-time positions, reflecting a nearly 40% decrease in employment since 2007, and a loss of approximately 3.6 million jobs during this period.
Within this landscape, small farms employed about 2.7 million full-time workers in 2022, comprising nearly 47% of the agricultural workforce. However, this group has experienced a significant decline from 2007 to 2022, with a loss of 3.8 million AWU, 3 million of which were unpaid positions. In 2022, out of the 2.7 million AWU, small farms still accounted for 2.4 million unpaid full-time positions, highlighting the reliance on unpaid labour in this sector.
Medium-sized farms accounted for 27% of the total AWU in 2022, showing a relatively balanced distribution between paid and unpaid labour. The number of AWU in this group has declined from 1.8 million in 2007 to 1.6 million in 2022.
In contrast, large farms represent a mere 11% of the total unpaid workforce but account for nearly 60% of the total paid AWU, suggesting that many large farms have formal legal structures that allow for paid employment. This group makes up approximately 25% of the total AWU in EU agriculture, with their numbers only increasing by around 300,000 AWU, from 1.2 million in 2007 to 1.5 million in 2022, despite the number of farms having doubled.
Crop protection, fertilisers and animals
Data on crop protection encompasses the costs for pesticides, traps, baits, frost protection, and more. When calculating the average cost per hectare of arable land in 2022, we find that small farms spend €96 per hectare, medium-sized farms spend €124 per hectare, and large enterprises spend €169 per hectare. These figures suggest that large farms utilise more plant protection measures, including pesticides suggesting a farming practice, which may be at the cost of biodiversity.
When calculating the total expenditure on fertilisers and soil improvements per hectare of arable land, a similar trend emerges, indicating that larger farms generally spend more than both medium-sized and small farms. Figures from 2022 reveal that small farms spent an average of €238 per hectare, medium and semi-large farms spent €260 per hectare, and large agricultural enterprises spent €290 per hectare.
Farm animals are quantified using the statistical value of livestock units (LU). Since 2007, the overall number of farm animals in Europe has decreased. This decline means that every group of farms has fewer animals in 2022 than in 2007. Notably, the largest farms have experienced the smallest decline per farm, indicating that the remaining livestock production is consolidating at these larger farms. The largest farms have seen a 42% increase in overall LU for the group, while they have also more than doubled the number of farms. Consequently, the average large farm has experienced a 9% decrease in LU. In contrast, the middle group has witnessed the largest average decline, with an overall reduction of 37% for farms in Europe and a 39% decrease in LU per farm. Because many small farms are no longer included in the statistics, the overall decrease for the entire group in LU is 57%, although the decline from 2007 to 2022 per farm is ‘only’ 24%.
Our position: Better collection of data
No comments yet.